He never made sea voyages, he made all his discoveries in his office, but his works worthily crown the era of the Great Geographical Discoveries. He brought together all the geographical knowledge accumulated in Europe and created the most accurate maps. The science called cartography originates with Gerardus Mercator.
In the 13th-14th centuries, a compass and nautical navigation maps appeared in Europe, on which the coastline was quite accurately displayed, and the inland areas of the land were filled with pictures from the life of the peoples who inhabited them, sometimes very far from reality. In 1375-1377, Abraham Cresques compiled the famous Catalan maps.
They reflected all the navigation experience accumulated by that time. Instead of a grid of parallels and meridians, lines were drawn on them, marking the direction indicated by the compass needle: they could be used to navigate long voyages. In 1409, Manuel Chrysoporus translated Ptolemy's Geography, rediscovering it for his contemporaries.
The sea voyages of Columbus, Vasco da Gama, and Magellan provided many new facts that did not fit into previous geographical ideas. They required comprehension and design in the form of a new geography, which made it possible to carry out long-distance trade and military campaigns. This task was completed by Gerardus Mercator, the famous geographer and author of new cartography.
This amazing map was drawn in 1538 by Gerhard Mercator, a highly respected cartographer who lived in the 16th century. His work is quite famous, and you can still buy a Mercator atlas in stores. He was the first to use the word "Atlas" for the collectionkart. And his work in geography was equally important fordevelopment of science, like Copernicus in astronomy. By the way, hewas friends and collaborated with a famous alchemist, magician andastrologer John Dee. He was good at mathematicsand at one time even taught it. Developed a waymass production of globes.
Gerhard Mercator was known for periodically updating his works and creating new, more detailed atlases of the world as more and more shores opened up to sailors and more and more accurate data came to him. In one such update, his 1538 world map (shown in the picture above) was replaced by a new one in 1569. And surprisingly, the 1538 map was not only more accurate than the later one, but also contained correct measurements of geographic longitude.
To understand the significance of this fact, it should be said that calculating longitude is a much more complex process than calculating latitude, which can be determined by observing the stars and the Sun. Calculating longitude requires solving the equation “Distance = Speed x Time” and, more importantly, an accurate clock. The determination of longitude was once called “the greatest problem of sea navigation” and in the 1700s in England a special Longitude Committee was even created to solve this problem. In 1714, Sir Isaac Newton appeared before the Committee and explained that the real root of the problem was that “clocks necessary for measuring such precision have not yet been invented.” The Queen of England then set a reward of 200 thousand pounds for the person who could build such a clock and finally, in 1761, a certain Harrison received this reward and put forward his prototype chronometer, which then “opened the world to a new era of sea travel.” During the 19th century, maps were updated with correct longitude measurements.
However, Mercator's map was marked with precise longitude values as early as 1538 - 223 years before it was discovered. Where did he get this information from? It is obvious that Mercator himself did not have any knowledge of longitude at that time and must have obtained this information from some other source, since subsequent maps were marked with incorrect values - and therefore their source was considered more reliable. These maps are fraught with a big mystery - if a person of deep antiquity never traveled around the world and did not have any knowledge of geographical longitude, then how did these maps even come into being? We don't know the answer to this question.
World map, 1531:
Gerard Mercator was born on March 5, 1512 in the city of Rupelmonde (modern Belgium), in a region that was then part of the Netherlands. He was the seventh child in a family that lived quite poorly. When Gerard was 14 or 15 years old, his father died and the family was left without a livelihood. Gerard's tutor becomes his relative, curé Gisbert Kremer. Thanks to him, Gerard receives an education at the gymnasium of the small town of Bois de Dunes. Although this gymnasium had a spiritual orientation, it also studied classical ancient languages and the principles of logic. At this time, Gerard changed his German surname Kremer, which means “shopkeeper”, to the Latin Mercator - “trader”, “merchant”.
He graduated from high school very quickly, in three and a half years, and almost immediately continued his studies at the University of Louvain, again thanks to the support of Gisbert Kremer. Louvain was the largest scientific and educational center in the Netherlands, with 43 gymnasiums, and its university, founded back in 1425, was the best in Northern Europe. The city became a center of humanistic education and free-thinking thanks to Erasmus of Rotterdam (1465-1536), who lived for some time in Louvain.
It was during his university years that Mercator developed a special interest in the natural sciences, especially astronomy and geography. He begins to read the works of ancient authors, trying to find out how the globe works. Subsequently, he would write: “When I became addicted to the study of philosophy, I really liked the study of nature, because it provides an explanation of the causes of all things and is the source of all knowledge, but I turned only to a particular issue - to the study of the structure of the world.” Convinced of the insufficiency of his knowledge in the field of mathematics, especially geometry, he begins to study it independently. The textbook that existed at that time clearly did not satisfy him, and he read the first seven books of Euclid’s Elements in the original.
“When I became addicted to the study of philosophy, I really liked the study of nature, because it is the source of all knowledge, but I turned only to the study of the structure of the world.” From a letter from G. Mercator
After graduating from university, Mercator received the degree of “master of arts” (licentiate) and remained to live in Louvain. Without losing touch with the university, he listens to lectures on the planets by Professor Gemma Frisius, one of the outstanding people of that time. A brilliant astronomer, mathematician, cartographer and doctor, Frisius paved new paths in science and practice. He wrote works on cosmography and geography, he made globes and astronomical instruments. Mercator becomes his student and assistant. Starting with engraving work, he then moved on to more complex ones - to the manufacture of globes, astrolabes and other astronomical instruments. The instruments he designed and manufactured brought him almost immediate fame due to their precision.
At the same time, Mercator was involved in the development of the mathematical foundations of cartography. The main problem was that due to the spherical shape of the Earth, its surface cannot be depicted on a plane without distortion, and it was necessary to find a way in which the images of the oceans and continents on the map would look most similar. At the age of 25, Mercator presented his first independent cartographic work: a map of Palestine, published in Louvain.
Next year he publishes a map of the world in a double heart-shaped projection, made very carefully and taking into account the latest geographical information. On this map, for the first time, the name America was extended to both continents of the New World, and America itself was depicted as separated from Asia, contrary to the then widespread misconception. All of Mercator’s works are subordinated to a single plan and are closely interconnected: in the explanatory text to the map, he says that the world shown on the map will subsequently be examined in detail.
In 1541, Mercator designed a celestial globe depicting stars and constellation figures,which became one of the best for that time. It rotated freely around an axis passing through the poles and fixed inside a massive copper ring. ABOUTThe distinctive feature of this globe was the grid of curved lines applied to its surface, designed to facilitate maritime navigation. These lines suggest that when Mercator created the globe, he had largely completed the development of the famous cartographic projection, which was later named after him.
The Mercator map projection increases the size of the polar countries, but makes it easy to determine the desired direction - this is of great importance in navigation.
Thanks to his work on making maps and astronomical instruments, Mercator became increasingly famous, his fame even reaching the King of Spain, Charles V. But his wide fame also attracted the attention of the Inquisition. Information appears that Mercator freely discusses inconsistencies in the teachings of Aristotle and the Bible, and in addition, he is constantly traveling, which in itself always looks suspicious in the eyes of the inquisitors. In 1544 he goes to prison. Numerous intercessions do not lead to success, and only after the intervention of Charles V, after spending four months in prison, Mercator regains his freedom.
Fearing persecution, he moves to Duisburg, where he can breathe more freely, but the working conditions are much worse. This city is remote from the sea and from trade routes, and it is more difficult to obtain information about the latest discoveries, obtain new drawings and maps here than in Louvain. However, the geographer Abraham Ortelius helps him out: close correspondence begins between his colleagues, thanks to which Mercator receives the necessary information.
In Duisburg he continues to work on the publication of maps. Now he works alone, drawing up, drawing, and engraving maps, composing inscriptions and legends, and also taking care of selling maps falls on his shoulders. The work on creating a comprehensive work on cosmography, which absorbed him entirely, began in 1564. Mercator conceived a cartographic work that included sections “Creation of the World”, “Description of Celestial Objects”, “Earth and Seas”, “Genealogy and History of States”, “Chronology”.
Due to the spherical shape of the Earth, its surface cannot be depicted on a plane absolutely accurately. On the maps compiled by Mercator, the outlines of the oceans and continents are presented with the least distortion.
In 1569, Mercator published a map of the World, which he called “A new and most complete image of the globe, verified and adapted for use in navigation.” It was made on 18 sheets; in its production, a new method of depicting a grid of parallels and meridians was used, which was later called the Mercator (or cylindrical) projection. When drawing up a map, he set himself the task of showing the globe on a plane so that the images of all points on the earth's surface corresponded to their true position, and the outlines of countries, if possible, were not distorted. Another goal was to depict the world known to the ancients - that is, the Old World - and the place it occupied on Earth. Mercator wrote that with the discovery of new continents, the achievements of the ancients in the study of the Old World appeared more clearly and vividly before the whole world, the image of which is presented with the most complete possible completeness on the map.
By 1571, Mercator completed the work he called “Atlas, or cartographic considerations about the creation of the world and the appearance of what was created.” Maps were included with the Atlas. Since then, the word “atlas” has become a common noun for a collection of maps. The publication of the Atlas was published only in 1595, a year after the death of Gerardus Mercator.
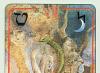
John Dee's map of 1582. On it we see almost the same image of Arctida as on the Mercator map of 1569, but without coloring different territories in different colors and without applying names. The arctida of the “pygmies” here protrudes to the south even more, but the section of coastline separated by a mountain range is completely absent here. America has moved very far from the Fourth Arctida, so the ocean in this place is very wide, and the narrowest place is in the strait that makes contact with Asia. So the tendency towards separation of the Arctida from the continents is carried out here to the greatest extent.
The brave sailors whose great voyages of exploration opened up the world are iconic figures in European history. In 1492 Columbus found the New World; In 1488 diameters discovered the Cape of Good Hope; and Magellan set out to sail around the world in 1519. However, there is one difficulty with this confident assertion of European prowess: it may not be true.
It seems more likely that the world and all its continents were discovered by a Chinese admiral named Zheng He, whose fleets roamed the oceans between 1405 and 1435. His exploits, which are well documented in Chinese historical accounts, were written about in a book that appeared in China around 1418, entitled “Amazing Visions of the Raft of the Star”.
A map on a stone from the city of Ica, Peru, the mainland is divided into 4 parts by rivers - in my opinion it looks like Hyperborea, if this is so, then this is the oldest map, the age of the stones is dated from several million to tens of millions of years! because among the stones found (there are more than 15,000 of them in total) there are images of dinosaurs, moreover, as petsThere is a tower on the island above.When traveling on foot or by bike, a topographic map is an indispensable companion for a researcher. One of the tasks cartography(one of the disciplines of such science as geodesy) is an image of the curved surface of the Earth (figure of the Earth) on a flat map. To solve this problem you need to choose ellipsoid- the shape of a three-dimensional body approximately corresponding to the earth's surface, datum— the starting point of the coordinate system (center of the ellipsoid) and the prime meridian (eng. prime meridian) And projection- a method of depicting the surface of this body on a plane.
Ellipsoids and datums
At different times, various options for representing the Earth's surface in the form of a sphere or ellipsoid were used to construct maps .
Representing the Earth as a sphere with a radius of 6378137 meters (or 6367600 meters) allows you to determine the coordinates of any point on the earth’s surface in the form of two numbers - latitude $\phi$ and longitude $\lambda$:
For earth's ellipsoid the concept used as (geographical) latitude geodetic latitude(English) geodetic latitude) φ - the angle formed by the normal to the surface of the earth's ellipsoid at a given point and the plane of its equator ,
and the normal does not pass through the center of the ellipsoid excluding the equator and poles: 
Longitude value longitude) λ depends on the choice of the initial (zero) meridian for the ellipsoid.
The radius of the major (equatorial) semi-axis is usually used as the parameters of the ellipsoid a
and compression f
.
The compression $f = ((a-b) \over a)$ determines the oblateness of the ellipsoid at the poles.
One of the first ellipsoids was Bessel ellipsoid(Bessel ellipsoid, Bessel 1841), determined from measurements in 1841 by Friedrich Bessel ( Friedrich Wilhelm Bessel), with the length of the semi-major axis a= 6377397.155 m and compression f =
1:299,152815
. It is currently used in Germany, Austria, the Czech Republic and some Asian and European countries. 
datum Potsdam (PD)

Previously, for constructing maps in projection UTM used international ellipsoid (International ellipsoid 1924, Hayford ellipsoid) with the length of the major (equatorial) semi-axis a= 6378388 m and compression f = 1:297,00
, proposed by American surveyor John Fillmore Hayford ( in 1910. 
John Fillmore Hayford
datum ED 50 (European Datum 1950)
- ellipsoid - International ellipsoid 1924
- Greenwich prime meridian)
To carry out work throughout the entire territory of the USSR since 1946 (Resolution of the Council of Ministers of the USSR dated April 7, 1946 No. 760), a geodetic coordinate system was used SK-42 (Pulkovo 1942), based on Krasovsky ellipsoid with the length of the major (equatorial) semi-axis a= 6378245 m and compression f= 1:298,3
. This reference ellipsoid is named after the Soviet astronomer-geodesist Feodosius Nikolaevich Krasovsky. The center of this ellipsoid is shifted relative to the Earth’s center of mass by approximately 100 meters to best match the Earth’s surface on the European territory of the USSR. 
datum Pulkovo-1942 (Pulkovo 1942)
- ellipsoid - Krasovsky ( Krassowsky 1940)
- prime meridian - Greenwich meridian ( Greenwich prime meridian)
Currently (including in the system GPS) ellipsoid is widely used WGS84 (World Geodetic System 1984) with major axle length a= 6378137 m, compression f = 1:298,257223563 and eccentricity e = 0,081819191 . The center of this ellipsoid coincides with the center of mass of the Earth.
datum WGS84 (EPSG:4326)
- ellipsoid - WGS84
- Prime Meridian - reference meridian (IERS Reference Meridian (International Reference Meridian)), passing 5.31″ east of the Greenwich meridian. It is from this meridian that longitude in the system is measured GPS(English) GPS longitude)
Center of coordinate system WGS84 coincides with the Earth's center of mass, axis Z coordinate system is aimed at support pole
(English) IERS Reference Pole (IRP) and coincides with the axis of rotation of the ellipsoid, the axis X passes along the line of intersection of the prime meridian and the plane passing through the origin point and perpendicular to the axis Z, axis Y perpedicular to the axis X.
An alternative to the ellipsoid WGS84 is an ellipsoid PZ-90, used in the system GLONASS, with the length of the semi-major axis a= 6378136 m and compression f = 1:298,25784 .
Datum conversions
With the simplest option of transition between datums Pulkovo-1942 And WGS84 it is necessary to take into account only the displacement of the center of the Krasovsky ellipsoid relative to the center of the ellipsoid WGS84:
recommended in GOST 51794-2001 —
dX= +00023.92 m; dY= –00141.27 m; dZ= –00080.91 m;
recommended in World Geodetic System 1984. NIMA, 2000 —
dX= +00028 m; dY= –00130 m; dZ= –00095 m.
It should be noted that the above are the average values of the coefficients, which for a more accurate conversion must be calculated for each point on the earth's surface individually. For example, for Poland, neighboring Belarus, these parameters are as follows:
dX= +00023 m; dY= –00124 m; dZ= –00082 m (according to data
)
This transformation is called three-parameter.
With a more accurate transformation ( transformation of Molodensky) it is necessary to take into account the difference between the shapes of the ellipsoids, determined by two parameters:
da- the difference between the lengths of the major semi-axes, df— difference between compression ratios (difference in flattening). Their values are the same for GOST And NIMA:
da= – 00108 m; df= + 0.00480795 ⋅ 10 -4 m. 
When transitioning between datums ED 50 And WGS84 The conversion parameters are:
da= – 00251 m; df= - 0.14192702 ⋅ 10 -4 m;
for Europe dX= -87 m; dY= –96 m; dZ= –120 m (according to User's Handbook on Datum Transformations involving WGS-84, 3rd edition, 2003
).
A set of the specified five parameters ( dX, dY, dZ, da, df) can be entered into a navigator or navigation program as a characteristic of the datum used by the user.
Projections
The method of depicting the three-dimensional earth's surface on a two-dimensional map is determined by the selected map projection.
Most popular ( normal) cylindrical Mercator projection and such a variety as transverse cylindrical Mercator projection (Transverse Mercator).
Unlike the normal Mercator projection, which has been known for centuries, which is especially good for depicting equatorial regions, the transverse projection differs in that the cylinder onto which the surface of the planet is projected is rotated by 90°: 
Cylindrical Mercator projection
Spherical Mercator projection
For a spherical projection, the following formulas apply for converting the latitude $\phi$ and longitude $\lambda$ of a point on the surface of the earth's sphere (in radians) into rectangular coordinates $x$ and $y$ on the map (in meters):
$x = (\lambda - (\lambda)_0) \cdot R$ ;
$y = arcsinh (\tan (\phi)) \cdot R =\ln ( (\tan( ((\phi \over 2) + (\pi \over 4) )) )) \cdot R$
(logarithmic tangent formula) ,
where $R$ is the radius of the sphere, $(\lambda)_0$ is the longitude of the prime meridian.
The scale factor $k$ represents the distance ratios along the map grid. grid distance) to local (geodesic) distance (eng. geodetic distance):
$k = (1 \over (\cos \phi))$.
Reverse translation is implemented using the following formulas:
$\lambda = (x \over R) + (\lambda)_0 $ ;
$ \phi = (\pi \over 2) - 2 \arctan(e^(-y \over R)) $ .
An important feature of the Mercator projection for navigation is that rumba line(English) rhumb lines) or rhoxodrome (eng. loxodrome) is depicted as a straight line.
A loxodrome is an arc that intersects the meridians at the same angle, i.e. path with constant ( loxodromic) path angle.
Track angle, PU(English) heading) is the angle between the north direction of the meridian at the measurement location and the direction of the track line, measured clockwise from the direction to the geographic north (0° is used to indicate the direction of movement to the north, 90° to the east).
Loxodromes are spirals that make an unlimited number of turns as they approach the poles. 
It should be noted that a rhoxodrome is not the shortest path between two points − orthodrome, arc great circle connecting these points .
Web Mercator
A variant of the Mercator spherical projection is used by many map services, e.g. OpenStreetMap, Google Maps, Bing Maps. 
IN OpenStreetMap the world map is a square with coordinates of points along the axes x And y, lying between -20,037,508.34 and 20,037,508.34 m. As a result, such a map does not show areas lying north of 85.051129° north latitude and south of 85.051129° south latitude. This value of latitude $\phi_(max)$ is the solution to the equation:
$\phi_(max) = 2\arctan(e^\pi) — (\pi\over 2) $ .
Like any map compiled in the Mercator projection, it is characterized by area distortions, which are most clearly manifested when comparing Greenland and Australia depicted on the map: 
When drawing a map in OpenStreetMap coordinates (latitude and longitude) on the ellipsoid in the system WGS84 are projected onto the map plane as if these coordinates were defined on a sphere with radius R = a= 6,378,137 m(reprojection) - spherical representation of ellipsoidal coordinates (" spherical development of ellipsoidal coordinates"). This projection, called Web Mercator) corresponds EPSG (European Petroleum Survey Group) code 3857 (" WGS 84/Pseudo-Mercator«).
Reprojecting from EPSG:4326 V EPSG:3857($\phi ,\lambda \rightarrow x,y $) is implemented according to the above formulas for the usual spherical Mercator projection.
On such a map, the direction to the north always corresponds to the direction to the top side of the map; the meridians are vertical lines equally spaced from each other.
But such a projection, unlike the spherical or elliptical Mercator projection, is not p monoangular ( conformal), the rumba lines in it are not straight. Rumba line (loxodrome) is a line intersecting the meridians at a constant angle.
The advantage of the projection under consideration is the simplicity of calculations.
In the specified projection, the map can be drawn with a rectangular coordinate grid (according to longitude and latitude values).
Map referencing (comparison of rectangular coordinates on the map and geographic coordinates on the ground) can be done using $N$ points with known coordinates. To do this, it is necessary to solve a system of $2 N$ equations of the form
$X = \rho_(\lambda) \lambda - X_0$ , $Y = arcsinh (\tan (\phi)) \cdot \rho_(\phi) - Y_0 $ .
To solve a system of equations and determine the values of parameters $X_0$ , $Y_0$ , $\rho_(\lambda)$ , $\rho_(\phi)$ you can use, for example, a mathematical package Mathcad.
To check the correctness of the map binding, you can determine the ratio of the lengths of the sides of the rectangle of the constructed grid. If the horizontal and vertical sides of a rectangle correspond to the same angular length in longitude and latitude, then the ratio of the length of the horizontal side (parallel arc - small circle) to the length of the vertical side (meridian arc - great circle) should be equal to $\cos \phi$ , where $ \phi$ is the geographic latitude of the place.
Elliptical Mercator projection
Elliptical Mercator projection ( EPSG:3395
— WGS 84/World Mercator) is used, for example, by services Yandex maps,Space photographs.
For an elliptical projection, the following formulas apply for converting the latitude $\phi$ and longitude $\lambda$ of a point on the surface of the earth's sphere (in radians) into rectangular coordinates $x$ and $y$ on the map (in meters):
$x = (\lambda - (\lambda)_0) \cdot a$ ;
$y = a \ln (\tan ((\pi \over 4) + (\phi \over 2)) (((1 - e \sin (\phi)) \over (1 + e \sin (\phi ))))^(e \over 2)) $ ,
where $a$ is the length of the semi-major axis of the ellipsoid, $e$ is the eccentricity of the ellipsoid, $(\lambda)_0$ is the longitude of the prime meridian.
The scale factor $k$ is given by:
$k = ((\sqrt ((1 - (e^2) (((\sin \phi))^2)))) \over (\cos \phi)) $ .
Reverse translation is implemented using the following formulas:
$\lambda = (x \over a) + (\lambda)_0 $ ;
$ \phi = (\pi \over 2) — 2 \arctan(e^(-y \over a) (((1 — e \sin (\phi)) \over (1 + e \sin (\phi) )))^(e \over 2)) $ .
Latitude is calculated using an iterative formula; as a first approximation, the value of latitude calculated using the formula for the spherical Mercator projection should be used.
Transverse cylindrical Mercator projection
The two most commonly used types of transverse Mercator projection are the Gauss-Kruger projection. Gauss-Krüger) (became widespread in the territory of the former USSR) and the universal transverse Mercator projection (eng. Universal Transverse Mercator (UTM)).
For both projections, the cylinder on which the projection occurs covers the earth's ellipsoid along a meridian called central (axial) meridian ( English central meridian, longitude origin) zones. Zone(English) zone) is a section of the earth's surface bounded by two meridians with a difference in longitude of 6°. There are 60 zones in total. The zones completely cover the Earth's surface between latitudes 80°S and 84°N.
The difference between the two projections is that the Gauss-Kruger projection is a projection onto a tangent cylinder, and the universal transverse Mercator projection is a projection onto a secant cylinder (to avoid distortions on the extreme meridians): 
Gauss-Kruger projection
The Gauss-Kruger projection was developed by German scientists Carl Gauss and Louis Kruger.
In this projection, zones are numbered from west to east, starting from the 0° meridian. For example, zone 1 extends from the 0° meridian to the 6° meridian, its central meridian is 3°.
In the Soviet system of layouts and nomenclature of topographic maps, zones are called columns and are numbered from west to east, starting from the 180° meridian.
For example, Gomel and its surroundings belong to the zone 6
(column 36
) with a central meridian of 33°.
Zones/columns are divided by parallels into rows (every 4°), which are designated by capital Latin letters from A before V, starting from the equator to the poles.
For example, Gomel and its surroundings belong to the series N. Thus, the full name of a sheet of a map at a scale of 1:1,000,000 (10 km in 1 cm), depicting Gomel, looks like N-36. This sheet is divided into sheets of maps of a larger scale: 
For Belarus and neighboring countries the schedule is as follows: 
To determine the position of a point using a topographic map, a grid of rectangular coordinates is applied to the map X And Y, expressed in kilometers. It is formed by a system of lines parallel to the image of the axial meridian of the zone (vertical grid lines, axes X) and perpendicular to it (horizontal grid lines, axes Y).
On a 1:200,000 scale map, the distance between grid lines is 4 km; on a map of scale 1:100,000 - 2 km.
Coordinate X is signed on the vertical edges of the map sheet and expresses the distance to the equator, and the coordinate Y is signed on the horizontal edges of the map sheet and consists of the zone number (the first one or two digits of the value) and the position of the point relative to the central meridian of the zone (the last three digits of the value, with the central meridian of the zone assigned a value of 500 km). 
fragment of sheet N36-123 of a Soviet topographic map at a scale of 1:100,000
For example, on the above fragment of the map the inscription 6366 near the vertical grid line means: 6 — 6th zone, 366 is the distance in kilometers from the axial meridian, conventionally moved westward by 500 km, and the inscription 5804 near the horizontal grid line indicates the distance from the equator in kilometers.
Universal Transverse Mercator Projection
Universal Transverse Mercator ( UTM) was developed by the US Army Corps of Engineers ( United States Army Corps of Engineers) in the 1940s.
To construct maps in projection UTM previously an ellipsoid was used International 1924— net UTM (International), and currently - an ellipsoid WGS84— net UTM (WGS84).
In this projection, zones are numbered from west to east, starting from the 180° meridian.
This system is used by the US and NATO armed forces. United States and NATO armed forces):
Each zone is divided into horizontal stripes every 8° latitude. These stripes are designated by letters, from south to north, starting from the letter C for latitude 80° S and ending with a letter X for latitude 84° N. Letters I And O omitted to avoid confusion with the numbers 1 and 0. The bar marked with the letter X, occupies 12° latitude.
The zone in this projection is designated by a number. longitude zone) and a letter (latitude channel, English. latitude zone):
This figure shows two non-standard zones of longitude - the zone 32V expanded to cover all of southern Norway, and area 31V shortened to cover water only.
For Gomel and its environs, the zone is designated as 36U with a central meridian of 33°: 
The zone is covered with a rectangular (kilometer) grid (grid according to the Universal Transverse Mercator Projection, UPPM): 
The side length of the grid square in the above map fragment is 10 km.
The origin of the coordinate system for each zone is determined by the intersection of the equator and the central meridian of the zone.
Coordinate E (Easting) on such a grid represents the distance on the map from the central meridian in meters (to the east - positive, to the west - negative), to which + 500,000 meters are added (eng. False Easting
Coordinate N (Northing) on such a grid represents the distance on the map from the equator in meters (to the north - positive, to the south - negative), and in the southern hemisphere this distance is subtracted from 10,000,000 meters (eng. False Northing) to avoid the appearance of negative values.
For example, for the lower left corner of the grid square in the map above, the coordinates are written as
36U(or 36+
) 380000 5810000
,
Where 36
— longitude zone, U
— latitude zone, 380000
— easting, 5810000
— northing.
Convert latitude and longitude to coordinates UTM illustrated by the picture:

P— point under consideration
F- the point of intersection of the perpendicular dropped to the central meridian from the point P, with the central meridian (a point on the central meridian with the same northing, as the point under consideration P) . Point latitude F(English) footprint latitude) is denoted as $\phi ‘ $ .
O- equator
OZ- central meridian
LP- parallel point P
ZP— meridian of a point P
OL = k 0 S- meridian arc from the equator
OF = N — northing
FP = E — easting
GN— direction to the north of the map grid (eng. grid north)
C- angle of convergence of meridians (eng. convergence of meridians) - the angle between the direction of true north (eng. true north) and to the north of the map grid
When transforming rectangular coordinates ( X, Y) for the Gauss-Kruger projection on an ellipsoid WGS84 to rectangular coordinates ( N, E) for the universal transverse Mercator projection on the same ellipsoid WGS84 it is necessary to take into account the scale factor scale factor) $k_0 = 0.9996 $ :
$ N = X \cdot k_0 $ ;
$ E = Y_0 + Y \cdot k_0 $ ,
where $Y_0 = 500,000 $ meters.
The specified scale factor $k_0 = 0.9996 $ is valid only for the central meridian of the zone. As you move away from the axial meridian, the scale factor changes.
Note. Error in reading coordinates from the map ( georeferencing accuracy) is usually taken to be ±0.2 mm. This is precisely the accuracy of the devices used to create an analog map.
Geoid
It should be noted that a more accurate approximation of the surface of our planet is geoid(English) geoid) is the equipotential surface of the earth’s gravity field, i.e. the surface of the geoid is everywhere perpendicular to the plumb line. But gravity is determined by the vector sum of the gravitational force from the Earth and the centrifugal force associated with the rotation of the Earth, so the gravity potential does not coincide with the purely gravitational potential.
The geoid coincides with the average level of the World Ocean, relative to which it is measured altitudes above sea level.
The geoid has a complex shape that reflects the distribution of masses inside the Earth, and therefore, to solve geodetic problems, the geoid is replaced by an ellipsoid of revolution. The most modern mathematical model of the geoid is EGM2008, which replaced the popular model EGM96.
To be continued.
Views: 9,375
The conformal cylindrical Mercator projection is the main and one of the first map projections. One of the first, so is the second to use. Before its appearance, they used the equidistant projection or geographical projection of Marnius of Tire, first proposed in 100 BC (2117 years ago). This projection was neither equal-area nor equiangular. Relatively accurate on this projection were the coordinates of the places closest to the equator.
Developed by Gerardus Mercator in 1569 to compile maps that were published in his “ Atlas». Projection name " equiangular" means that the projection preserves angles between directions, known as constant courses or rhumb angles. All curves on the Earth's surface in the equiangular cylindrical Mercator projection are depicted by straight lines.
"... The UTM map projection was developed between 1942 and 1943 in the German Wehrmacht. Its development and appearance was probably carried out in the Abteilung für Luftbildwesen (Aerial Photography Department) of Germany... since 1947 the US Army has used a very similar system, but with a standard scale factor of 0.9996 at the central meridian, as opposed to the German 1.0.
A little theory (and history) about the Mercator conformal cylindrical projection
In the Mercator projection, meridians are parallel, equally spaced lines. Parallels are parallel lines, the distance between which near the equator is equal to the distance between the meridians, increasing as they approach the poles. Thus, the scale of distortion towards the poles becomes infinite, for this reason the South and North Poles are not depicted on the Mercator projection. Maps in the Mercator projection are limited to the areas of 80° - 85° north and south latitude.
"The Universal Transverse Mercator (UTM) projection uses a 2-dimensional Cartesian coordinate system... that is, it is used to determine a location on Earth, regardless of the location's altitude...
All lines of constant courses (or points) on Mercator maps are represented by straight segments. Two properties, equiangularity and straight bearing lines, make this projection uniquely suited for use in nautical navigation: headings and bearings are measured using a compass rose or protractor, and corresponding bearings are easily transferred from point to point on a chart using a parallel ruler or a pair of nautical protractors. for drawing lines.
The name and explanation defined by Mercator on his world map Nova et Aucta Orbis Terrae Descriptio ad Usum Navigantium Emendata: “ New, expanded and corrected description of the Earth for use by sailors" indicates that it was specifically designed for maritime use.

Transverse Mercator projection.
Although the method of constructing the projection is not explained by the author, Mercator probably used a graphical method, transferring some of the rhumb lines previously drawn on the globe to a rectangular grid (a grid formed by lines of latitude and longitude), and then adjusting the distance between the parallels so that these lines became straight, which created the same angle with the meridian, as on the globe.
The development of the Mercator cartographic conformal projection represented a major breakthrough in 16th-century nautical cartography. However, its introduction was far ahead of its time, as older navigational and surveying methods were not compatible with its use in navigation.
Two major problems prevented its immediate use: the inability to determine longitude at sea with sufficient accuracy, and the fact that maritime navigation used magnetic rather than geographic directions. It was only almost 150 years later, in the mid-18th century, after the marine chronometer was invented and the spatial distribution of magnetic declination became known, that the Mercator map conformal projection was fully accepted in maritime navigation.
The Gauss-Kruger map conformal projection is synonymous with the transverse Mercator projection, but in the Gauss-Kruger projection the cylinder rotates not around the equator (as in the Mercator projection), but around one of the meridians. The result is a conformal projection that does not maintain the correct directions.
The central meridian is in the region that can be selected. Along the central meridian, distortions of all properties of objects in the region are minimal. This projection is most suitable for mapping areas that extend from north to south. The Gauss-Kruger coordinate system is based on the Gauss-Kruger projection.
The Gauss-Kruger map projection is completely similar to the universal transverse Mercator projection; the width of the zones in the Mercator projection is 6°, while in the Gauss-Kruger projection the width of the zones is 3°. The Mercator projection is convenient for sailors to use, and the Gauss-Kruger projection is convenient for ground forces in limited areas of Europe and South America. In addition, the Mercator projection is 2-dimensional, and the accuracy of determining latitude and longitude on a map does not depend on the height of the place, while the Gauss-Kruger projection is 3-dimensional, and the accuracy of determining latitude and longitude is constantly dependent on the height of the place.
Before the end of World War II, this cartographic problem was particularly acute, since it complicated the issues of interaction between the fleet and ground forces during joint operations.

Equatorial Mercator projection.
Is it possible to combine these two systems into one? It is possible that it was produced in Germany between 1943 and 1944.
The Universal Transverse Mercator (UTM) projection uses a 2-dimensional Cartesian coordinate system to provide a location on the Earth's surface. Like the traditional latitude and longitude method, it represents a horizontal position, that is, it is used to determine a location on Earth, regardless of the height of the place.
History of the emergence and development of the UTM map projection
However, it differs from this method in several respects. The UTM system is not just a map projection. The UTM system divides the Earth into sixty zones, each of six degrees of longitude, and uses an intersecting Transverse Mercator projection in each zone.
Most American published publications do not indicate the original source of the UTM system. NOAA's website claims that the system was developed by the US Army Corps of Engineers, and the published material, which does not claim provenance, appears to be based on this assessment.
"Scale distortion increases in each UTM zone as the boundaries between UTM zones get closer. However, it is often convenient or necessary to measure a number of locations in one grid when some of them are located in two adjacent zones...
However, a series of aerial photographs found in the Bundesarchiv-Militärarchiv (military section of the German Federal Archives) appear to have the inscription UTMREF in logical coordinate letters and numbers, and displayed according to the transverse Mercator projection, starting from 1943 - 1944. This find provides excellent evidence that the UTM map projection was developed between 1942 and 1943 by the German Wehrmacht. Its development and appearance were probably carried out by the Abteilung für Luftbildwesen (Department of Aerial Photography) in Germany. Subsequently, from 1947, the US Army used a very similar system, but with a standard scale factor of 0.9996 on the central meridian, as opposed to the German 1.0.
For areas within the United States, the 1866 Clarke ellipsoid was used. For other regions of the Earth, including Hawaii, the International Ellipsoid was used. The WGS84 ellipsoid is now commonly used to model the Earth in a UTM coordinate system, meaning that the current UTM ordinate at a given point can differ by up to 200 meters from the old system. For different geographical regions, for example: ED50, NAD83, other coordinate systems can be used.
Prior to the development of the universal Transverse Mercator projection coordinate system, several European countries demonstrated the usefulness of gridded conformal mapping (local angle preserving) cartography for their territories during the interwar period.
Calculation of distances between two points on these maps could be done easily in the field (using the Pythagorean theorem), compared to the possible use of trigonometric formulas required by a grid based system of latitude and longitude. In the postwar years, these concepts were expanded into the Universal Transverse Mercator/Universal Polar Stereographic System (UTM/UPS), which is a global (or universal) coordinate system.
The Transverse Mercator projection is a variant of the Mercator projection, which was originally developed by the Flemish geographer and cartographer Gerardus Mercator in 1570. This projection is conformal, meaning that angles are preserved and therefore allows small regions to be formed. However, it distorts distance and area.
The UTM system divides the Earth between 80° south latitude and 84° north latitude into 60 zones, each zone equal to 6° longitude in width. Zone 1 covers longitudes from 180° to 174° W (west); The numbering zone increases eastward towards zone 60, which covers longitudes from 174° to 180° E (East longitude).
Each of the 60 zones uses a transverse Mercator projection, which can map a more north-south area with low distortion. By using narrow zones of 6° longitude (up to 800 km) in width, and reducing the scale factor along the central meridian to 0.9996 (1:2500 reduction), the amount of distortion is kept below 1 part of 1000 in within each zone. The scale distortion increases to 1.0010 at the zone boundaries along the equator.
In each zone, the central meridian scale factor reduces the diameter of the transverse cylinder to produce an intersecting projection with two standard or true scale lines, about 180 km on each side, and approximately parallel to the central meridian (Arc cos 0.9996 = 1.62° at the equator) . The scale is less than 1 inside standard lines and greater than 1 outside them, but overall distortion is kept to a minimum.
Scale distortion increases in each UTM zone as the boundaries between UTM zones get closer. However, it is often convenient or necessary to measure a number of locations in one grid when some of them are located in two adjacent zones.
Around large scale map boundaries (1:100,000 or larger), coordinates for both adjacent UTM zones are usually printed within a minimum distance of 40 km on either side of the zone boundary. Ideally, the coordinates of each position should be measured on the grid for the zone in which they are located, and the scale factor of the still relatively small near-field boundaries can be overlapped by measurements into the adjacent zone some distance away when necessary.
Latitude bands are not part of the UTM system, but rather part of the military reference coordinate system (MGRS). They are, however, sometimes used.

Ellipsoidal Mercator projection.
Each zone is segmented into 20 latitudinal bands. Each latitudinal strip is 8 degrees high, and begins in block letters with " C"at 80°S (south latitude), increasing in the English alphabet to the letter " X", skipping the letters " I" And " O"(due to their similarity to the digits one and zero). Last range latitude, " X", is extended an additional 4 degrees, so that it ends at 84° north latitude, thus covering the northernmost part on Earth.
Conclusion on Mercator Map Projection (UTM/UPS)
Bandwidth " A" And " B"really exist, just like stripes" Y" And " Z" They cover the western and eastern sides of the Antarctic and Arctic regions, respectively. It is convenient to remember mnemonically that any letter preceding " N" in alphabetical order - the zone is in the southern hemisphere, and any letter after the letter " N" - when the zone is in the northern hemisphere.
The combination of zone and latitude band determines the grid zone. The zone is always recorded first, followed by the latitude band. For example, the position in Toronto, Canada, will be in the 17th and latitude zone " T", thus the full reference grid zone " 17T" Grid zones serve to define the boundaries of irregular UTM zones. They are also an integral part of the military coordinate system reference grid. The method is also used to simply add N or S after the zone number to indicate the northern or southern hemisphere (to the planned coordinates, along with the zone number, is everything necessary to determine the position, except on which hemisphere).
Look at this map and tell me which territory is larger: Greenland, marked in white, or Australia, marked in orange? It seems that Greenland is at least three times larger than Australia.
But, looking at the reference book, we are surprised to read that the area of Australia is 7.7 million km 2, and the area of Greenland is only 2.1 million km 2. So Greenland seems so big only on our map, but in reality it is about three and a half times smaller than Australia. Comparing this map with a globe, you can see that the further a territory is from the equator, the more it is stretched.
The map we are looking at was built using a cartographic projection, which was invented in the 16th century by the Flemish scientist Gerardus Mercator. He lived in an era when new trade routes were being built across the oceans. Columbus discovered America in 1492, and the first voyage around the world under the leadership of Magellan took place in 1519–1522 - when Mercator was 10 years old. Open lands had to be plotted on maps, and for this it was necessary to learn how to depict a round Earth on a flat map. And the maps had to be made in such a way that it would be convenient for the captains to use them.
How does the captain use the map? He plots a course along it. Navigators of the 13th–16th centuries used portolans - maps that depicted the Mediterranean Sea basin, as well as the coasts of Europe and Africa lying beyond Gibraltar. Such maps were marked with a grid of rhumbs - lines of constant direction. Let the captain need to sail on the open sea from one island to another. He applies a ruler to the map, determines the course (for example, “to the south-southeast”) and gives the helmsman the order to keep this course according to the compass.
Mercator's idea was to preserve the principle of plotting a course using a ruler and on a world map. That is, if you keep a constant direction on the compass, then the path on the map will be straight. But how to do that? And here mathematics comes to the aid of the cartographer. Mentally cut the globe into narrow strips along the meridians, as shown in the figure. Each such strip can be unfolded on a plane without much distortion, after which it will turn into a triangular figure - a “wedge” with curved sides.


However, the globe turns out to be dissected, and the map should be continuous, without cuts. To achieve this, we divide each wedge into “almost squares”. To do this, from the lower left point of the wedge, draw a segment at an angle of 45° to the right side of the wedge, from there we draw a horizontal cut to the left side of the wedge - cut off the first square. From the point where the cut ends, we again draw a segment at an angle of 45° to the right side, then a horizontal one to the left, cutting off the next “almost square”, and so on. If the original wedge was very narrow, the "almost squares" will differ only slightly from true squares, since their sides will be almost vertical.

Let's complete the final steps. Let's straighten the "almost squares" to a real square shape. As we understand, the distortions can be made as small as desired by reducing the width of the wedges into which we cut the globe. Let's put the squares that are adjacent to the equator on the globe in a row. We will place all the other squares on them in order, first stretching them to the size of the equatorial squares. The result is a grid of squares of the same size. True, in this case, parallels that are equally spaced on the map will no longer be equally spaced on the globe. After all, the further the original square on the globe was from the equator, the greater the magnification it underwent when transferred to the map.
However, the angles between the directions with this construction will remain undistorted, because each square has practically only changed in scale, and the directions do not change when the picture is simply enlarged. And this is exactly what Mercator wanted when he came up with his projection! The captain can plot his course on the map using a ruler and guide his ship along this course. In this case, the ship will sail along a line going at the same angle to all meridians. This line is called rhoxodrome .
Sailing along the rhyme is very convenient because it does not require any special calculations. True, a rhoxodrome is not the shortest line between two points on the earth's surface. Such a shortest line can be determined by pulling a thread on a globe between these points.
Artist Evgeniy Panenko