A very convenient invention of the computer world is spreadsheets. You can enter data into them and beautifully arrange them in the form of documents to your taste (or to the taste of your superiors).
You can create such a document once - in fact, a whole family of documents at once, which, in Excel terminology, is called a “workbook” (English version of workbook).
How Excel behaves
Then you just need to change a few initial numbers when the data changes, and then Excel will perform several actions at once, arithmetic and others. It's in the document:

To do this, a spreadsheet program (and Excel is far from the only one) has a whole arsenal of arithmetic tools and ready-made functions performed using already debugged and workable programs. You just need to indicate in any cell when writing a formula, among other operands, the name of the corresponding function and, in parentheses to it, the arguments.
There are a lot of functions and they are grouped by application areas:

There is a whole set of statistical functions for summarizing multiple data. Getting the average value of some data is probably the very first thing that comes to a statistician’s mind when he looks at the numbers.
What is the average?
This is when a certain series of numbers is taken, two values are calculated from them - the total number of numbers and their total sum, and then the second is divided by the first. Then you get a number whose value is somewhere in the very middle of the series. Perhaps it will even coincide with some of the numbers in the series.
Well, let’s assume that that number was terribly lucky in this case, but usually the arithmetic mean not only does not coincide with any of the numbers in its series, but even, as they say, “doesn’t fit into any gates” in this series . For example, average number of people There may be 5,216 people living in apartments in some city in N-Ska. How is that? Are there 5 people living and an additional 216 thousandths of one of them? Those who know will only grin: what are you talking about! These are statistics!
Statistical (or simply accounting) tables can be of completely different shapes and sizes. Actually, the shape is a rectangle, but they can be wide, narrow, repeating (say, data for a week by day), scattered on different sheets of your workbook.
Or even in other workbooks (that is, in books, in English), and even on other computers on the local network, or, scary to say, in other parts of our world, now united by the all-powerful Internet. A lot of information can be obtained from very reputable sources on the Internet in ready-made form. Then process, analyze, draw conclusions, write articles, dissertations...
As a matter of fact, today we just need to calculate the average on some array of homogeneous data, using the miraculous spreadsheet program. Homogeneous means data about some similar objects and in the same units of measurement. So that people will never be summed up with sacks of potatoes, and kilobytes with rubles and kopecks.
Example of finding the average value
 Let us have the initial data written in some cells. Usually, generalized data, or data obtained from the original data, is somehow recorded here.
The initial data is located on the left side of the table (for example, one column is the number of parts produced by one employee A, which corresponds to a separate line in the table, and the second column is the price of one part), the last column indicates the output of employee A in money.
Previously, this was done using a calculator, but now you can entrust such a simple task to a program that never makes mistakes.
Simple daily earnings table
 Here in the picture amount of earnings and it is calculated for each employee in column E using the formula of multiplying the number of parts (column C) by the price of parts (column D).
Then he won’t even be able to step into other places in the table, and he won’t be able to look at the formulas. Although, of course, everyone in that workshop knows how the output of an individual worker turns into the money he earns in a day.
Total values
Then the total values are usually calculated. These are summary figures throughout the workshop, area, or the entire team. Usually these figures are reported by some bosses to others - higher up bosses.
This is how you can calculate the amounts in the source data columns, and at the same time in the derived column, that is, the earnings column
Let me immediately note that while the Excel table is being created, no protection is done in the cells. Otherwise, how would we draw the sign itself, introduce the design, color it and enter smart and correct formulas? Well, when everything is ready, before giving this workbook (that is, a spreadsheet file) to a completely different person, protection is done. Yes, simply from a careless action, so as not to accidentally damage the formula.
And now the self-calculating table will begin to work in the workshop along with the rest of the workshop workers. After the working day is over, all such tables of data about the work of the workshop (and not only one of it) are transferred to high management, who will summarize this data the next day and draw some conclusions.
Here it is, average (mean - in English)
 It comes first will calculate the average number of parts, produced per employee per day, as well as the average daily earnings for the workshop workers (and then for the plant). We will also do this in the last, lowest row of our table.
As you can see, you can use the amounts already calculated in the previous line, simply divide them by the number of employees - 6 in this case.
In formulas, dividing by constants, constant numbers, is bad form. What if something out of the ordinary happens to us, and the number of employees becomes smaller? Then you will need to go through all the formulas and change the number seven to some other one everywhere. You can, for example, “deceive” the sign like this:
Instead of a specific number, put a link in the formula to cell A7, where the serial number of the last employee from the list is. That is, this will be the number of employees, which means we correctly divide the amount for the column of interest to us by the number and get the average value. As you can see, the average number of parts turned out to be 73 and plus a mind-blowing in terms of numbers (though not in significance) makeweight, which is usually thrown out by rounding.
Rounding to the nearest kopeck
 Rounding is a common action when in formulas, especially accounting ones, one number is divided by another. Moreover, this is a separate topic in accounting. Accountants have been involved in rounding for a long time and scrupulously: they immediately round every number obtained by division to the nearest kopeck.
Excel is a mathematical program. She is not in awe of a share of a penny - where to put it. Excel simply stores the numbers as is, with all decimal places included. And again and again he will carry out calculations with such numbers. And the final result can be rounded (if we give the command).
Only accounting will say that this is a mistake. Because they round each resulting “crooked” number to whole rubles and kopecks. And the end result usually turns out a little different than that of a program indifferent to money.
But now I’ll tell you the main secret. Excel can find the average value without us; it has a built-in function for this. She only needs to specify the data range. And then she herself will sum them up, count them, and then she herself will divide the amount by the quantity. And the result will be exactly the same as what we comprehended step by step.
In order to find this function, we go to cell E9, where its result should be placed - the average value in column E, and click on the icon fx, which is to the left of the formula bar.
- A panel called “Function Wizard” will open. This is a multi-step dialogue (Wizard, in English), with the help of which the program helps in constructing complex formulas. And, note that the help has already begun: in the formula bar, the program entered the = sign for us.
- Now we can be calm, the program will guide us through all the difficulties (either in Russian or in English) and as a result the correct formula for the calculation will be built.
 In the top window (“Search for function:”) it is written that we can search and find here. That is, here you can write “average” and click the “Find” button (Find, in English). But you can do it differently. We know that this function is from the statistical category. So we will find this category in the second window. And in the list that opens below, we will find the “AVERAGE” function.
At the same time we will see how great it is there many functions in the statistical category, there are 7 averages alone. And for each of the functions, if you move the pointer over them, below you can see a brief summary of this function. And if you click even lower, on the inscription “Help for this function,” you can get a very detailed description of it.
Now we'll just calculate the average. Click “OK” (this is how agreement is expressed in English, although it’s more likely in American) on the button below.
The program has entered the beginning of the formula, now we need to set the range for the first argument. Just select it with the mouse. Click OK and get the result. Left add rounding here, which we made in cell C9, and the plate is ready for daily use.
Most of all in eq. In practice, we have to use the arithmetic mean, which can be calculated as the simple and weighted arithmetic mean.
Arithmetic average (SA)-n The most common type of average. It is used in cases where the volume of a varying characteristic for the entire population is the sum of the values of the characteristics of its individual units. Social phenomena are characterized by the additivity (totality) of the volumes of a varying characteristic; this determines the scope of application of SA and explains its prevalence as a general indicator, for example: the general salary fund is the sum of the salaries of all employees.
To calculate SA, you need to divide the sum of all feature values by their number. SA is used in 2 forms.
Let's first consider a simple arithmetic average.
1-CA simple (initial, defining form) is equal to the simple sum of the individual values of the characteristic being averaged, divided by the total number of these values (used when there are ungrouped index values of the characteristic):
The calculations made can be generalized into the following formula:
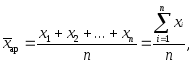 (1)
(1)
Where  - the average value of the varying characteristic, i.e., the simple arithmetic average;
 means summation, i.e. the addition of individual characteristics;
x- individual values of a varying characteristic, which are called variants;
n - number of units of the population
Example 1, it is required to find the average output of one worker (mechanic), if it is known how many parts each of 15 workers produced, i.e. given a series of ind. attribute values, pcs.: 21; 20; 20; 19; 21; 19; 18; 22; 19; 20; 21; 20; 18; 19; 20.
Simple SA is calculated using formula (1), pcs.:
Example2. Let's calculate SA based on conditional data for 20 stores included in the trading company (Table 1). Table 1
Distribution of stores of the trading company "Vesna" by sales area, sq. M
|
Store no. |
Store no. | ||
To calculate the average store area (  ) it is necessary to add up the areas of all stores and divide the resulting result by the number of stores:

Thus, the average store area for this group of retail enterprises is 71 sq.m.
Therefore, to determine a simple SA, you need to divide the sum of all values of a given attribute by the number of units possessing this attribute.
2
Where f 1
,
f 2
,
… ,f n
–
weight (frequency of repetition of identical signs); – the sum of the products of the magnitude of features and their frequencies; – the total number of population units.![]() (2)
(2)
Where X- options;
f- frequency (weight).
Weighted SA is the quotient of dividing the sum of the products of options and their corresponding frequencies by the sum of all frequencies. Frequencies ( f) appearing in the SA formula are usually called scales, as a result of which the SA calculated taking into account the weights is called weighted.
We will illustrate the technique of calculating weighted SA using example 1 discussed above. To do this, we will group the initial data and place them in the table.
The average of the grouped data is determined as follows: first, the options are multiplied by the frequencies, then the products are added and the resulting sum is divided by the sum of the frequencies.
According to formula (2), the weighted SA is equal, pcs.: ![]()

P

Distribution of Vesna stores by sales area, sq. m
Thus, the result was the same. However, this will already be a weighted arithmetic mean value.
In the previous example, we calculated the arithmetic average provided that the absolute frequencies (number of stores) are known. However, in a number of cases, absolute frequencies are absent, but relative frequencies are known, or, as they are commonly called, frequencies that show the proportion or the proportion of frequencies in the entire set.
When calculating SA weighted use frequencies allows you to simplify calculations when the frequency is expressed in large, multi-digit numbers. The calculation is made in the same way, however, since the average value turns out to be increased by 100 times, the result should be divided by 100.
Then the formula for the arithmetic weighted average will look like:
Where d– frequency, i.e. the share of each frequency in the total sum of all frequencies.
(3)In our example 2, we first determine the share of stores by group in the total number of stores of the Vesna company. So, for the first group the specific gravity corresponds to 10%  . We get the following data Table3
In mathematics and statistics average arithmetic (or easy average) of a set of numbers is the sum of all the numbers in this set divided by their number. The arithmetic mean is a particularly universal and most common representation of an average.
You will need
- Knowledge of mathematics.
Instructions
1. Let a set of four numbers be given. Need to be discovered average meaning this kit. To do this, we first find the sum of all these numbers. Possible numbers are 1, 3, 8, 7. Their sum is S = 1 + 3 + 8 + 7 = 19. The set of numbers must consist of numbers of the same sign, otherwise the sense in calculating the average value is lost.
2. Average meaning set of numbers is equal to the sum of numbers S divided by the number of these numbers. That is, it turns out that average meaning equals: 19/4 = 4.75.
3. For a set of numbers it is also possible to detect not only average arithmetic, but also average geometric. The geometric mean of several regular real numbers is a number that can replace any of these numbers so that their product does not change. The geometric mean G is sought using the formula: the Nth root of the product of a set of numbers, where N is the number in the set. Let's look at the same set of numbers: 1, 3, 8, 7. Let's find them average geometric. To do this, let's calculate the product: 1*3*8*7 = 168. Now from the number 168 you need to extract the 4th root: G = (168)^1/4 = 3.61. Thus average the geometric set of numbers is 3.61.
Average The geometric average is generally used less often than the arithmetic average, however, it can be useful when calculating the average value of indicators that change over time (the salary of an individual employee, the dynamics of academic performance indicators, etc.).

You will need
- Engineering calculator
Instructions
1. In order to find the geometric mean of a series of numbers, you first need to multiply all these numbers. Let's say you are given a set of five indicators: 12, 3, 6, 9 and 4. Let's multiply all these numbers: 12x3x6x9x4=7776.
2. Now from the resulting number you need to extract the root of a power equal to the number of elements of the series. In our case, from the number 7776 it will be necessary to extract the fifth root using an engineering calculator. The number obtained after this operation - in this case the number 6 - will be the geometric mean for the initial group of numbers.
3. If you don’t have an engineering calculator at hand, then you can calculate the geometric mean of a series of numbers using the SRGEOM function in Excel or using one of the online calculators specifically designed for calculating geometric mean values.
Note!
If you need to find the geometric mean of each for 2 numbers, then you do not need an engineering calculator: you can extract the second root (square root) of any number using the most ordinary calculator.
Helpful advice
Unlike the arithmetic mean, the geometric mean is not so powerfully affected by huge deviations and fluctuations between individual values in the set of indicators under study.
Average value is one of the collations of a set of numbers. Represents a number that cannot fall outside the range defined by the largest and smallest values in that set of numbers. Average arithmetic value is a particularly commonly used type of average.

Instructions
1. Add up all the numbers in the set and divide them by the number of terms to get the arithmetic mean. Depending on certain calculation conditions, it is sometimes easier to divide each of the numbers by the number of values in the set and sum the total.
2. Use, say, the calculator included with Windows OS if calculating the arithmetic average in your head is not possible. You can open it with support from the program launch dialog. To do this, press the “hot keys” WIN + R or click the “Start” button and select the “Run” command from the main menu. After that, type calc in the input field and press Enter on your keyboard or click the “OK” button. The same can be done through the main menu - open it, go to the “All programs” section and to the “Typical” segments and select the “Calculator” line.
3. Enter all the numbers of the set step by step by pressing the Plus key on the keyboard after all of them (besides the last one) or by clicking the corresponding button in the calculator interface. You can also enter numbers either from the keyboard or by clicking the corresponding interface buttons.
4. Press the slash key or click this icon in the calculator interface after entering the last value of the set and type the number of numbers in the sequence. After that, press the equal sign and the calculator will calculate and display the arithmetic mean.
5. You can use the Microsoft Excel spreadsheet editor for the same purpose. In this case, launch the editor and enter all the values of the sequence of numbers into the adjacent cells. If, after entering the entire number, you press Enter or the down or right arrow key, the editor itself will move the input focus to the adjacent cell.
6. Select all entered values and in the lower left corner of the editor window (in the status bar) you will see the arithmetic mean value for the selected cells.
7. Click the cell next to the last number entered if you just want to see the average. Expand the drop-down list with the image of the Greek letter sigma (Σ) in the Editing command group on the Main tab. Select the line " Average" and the editor will insert the necessary formula for calculating the arithmetic mean into the selected cell. Press the Enter key and the value will be calculated.
The arithmetic mean is one of the measures of central propensity, widely used in mathematics and statistical calculations. It is very easy to find the arithmetic average for several values, but every problem has its own nuances, which you need to know in order to perform correct calculations.

What is an arithmetic mean
The arithmetic mean defines the average value for each initial array of numbers. In other words, from a certain set of numbers a value that is universal for all elements is selected, the mathematical comparison of which with all elements is approximately equal. The arithmetic average is used preferably in the preparation of financial and statistical reports or for calculating the quantitative results of similar skills.
How to find the arithmetic mean
Finding the arithmetic mean for an array of numbers should begin by determining the algebraic sum of these values. For example, if the array contains the numbers 23, 43, 10, 74 and 34, then their algebraic sum will be equal to 184. When writing, the arithmetic mean is denoted by the letter? (mu) or x (x with a line). Next, the algebraic sum should be divided by the number of numbers in the array. In the example under consideration there were five numbers, therefore the arithmetic mean will be equal to 184/5 and will be 36.8.
Features of working with negative numbers
If the array contains negative numbers, then the arithmetic mean is found using a similar algorithm. The difference only exists when calculating in the programming environment, or if the problem contains additional data. In these cases, finding the arithmetic mean of numbers with different signs comes down to three steps: 1. Finding the universal arithmetic mean using the standard method;2. Finding the arithmetic mean of negative numbers.3. Calculation of the arithmetic mean of positive numbers. The results of each action are written separated by commas.
Natural and decimal fractions
If an array of numbers is represented by decimal fractions, the solution is carried out using the method of calculating the arithmetic mean of integers, but the reduction of the total is made according to the requirements of the problem for the accuracy of the result. When working with natural fractions, they should be reduced to a common denominator, the one that is multiplied by the number of numbers in the array. The numerator of the result will be the sum of the given numerators of the initial fractional elements.
The geometric mean of numbers depends not only on the absolute value of the numbers themselves, but also on their number. It is impossible to confuse the geometric mean and the arithmetic mean of numbers, since they are found using different methodologies. In this case, the geometric mean is invariably less than or equal to the arithmetic mean.

You will need
- Engineering calculator.
Instructions
1. Consider that in the general case the geometric mean of numbers is found by multiplying these numbers and taking from them the root of the power that corresponds to the number of numbers. For example, if you need to find the geometric mean of five numbers, then you will need to extract the fifth root from the product.
2. To find the geometric mean of 2 numbers, use the basic rule. Find their product, then take the square root of the number two, which corresponds to the degree of the root. Let's say, in order to find the geometric mean of the numbers 16 and 4, find their product 16 4 = 64. From the resulting number, take the square root?64=8. This will be the desired value. Please note that the arithmetic mean of these 2 numbers is larger and equal to 10. If the root is not extracted in its entirety, round the total to the required order.
3. To find the geometric mean of more than 2 numbers, also use the basic rule. To do this, find the product of all numbers for which you need to find the geometric mean. From the resulting product, extract the root of the power equal to the number of numbers. Let's say, in order to find the geometric mean of the numbers 2, 4 and 64, find their product. 2 4 64=512. Because it is necessary to find the result of the geometric mean of 3 numbers, extract the third root from the product. It is difficult to do this verbally, so use an engineering calculator. For this purpose it has a button “x^y”. Dial the number 512, press the “x^y” button, then dial the number 3 and press the “1/x” button to find the value 1/3, press the “=” button. We get the result of raising 512 to the power of 1/3, which corresponds to the third root. Get 512^1/3=8. This is the geometric mean of the numbers 2.4 and 64.
4. With the support of an engineering calculator, you can find the geometric mean using another method. Find the log button on your keyboard. After this, take the logarithm for all of the numbers, find their sum and divide it by the number of numbers. Take the antilogarithm from the resulting number. This will be the geometric mean of the numbers. Let's say, in order to find the geometric mean of the same numbers 2, 4 and 64, perform a set of operations on the calculator. Dial the number 2, then press the log button, press the “+” button, dial the number 4 and press log and “+” again, dial 64, press log and “=”. The result will be a number equal to the sum of the decimal logarithms of the numbers 2, 4 and 64. Divide the resulting number by 3, since this is the number of numbers by which the geometric mean is sought. From the total, take the antilogarithm by switching the register button and use the same log key. The result will be the number 8, this is the desired geometric mean.
Note!
The average value cannot be larger than the largest number in the set and smaller than the smallest.
Helpful advice
In mathematical statistics, the average value of a quantity is called the mathematical expectation.
Arithmetic mean in excel. Excel tables are ideal for all kinds of calculations. Having studied Excel, you will be able to solve problems in chemistry, physics, mathematics, geometry, biology, statistics, economics and many others. We don't even think about what a powerful tool is on our computers, which means we don't use it to its full potential. Many parents think that a computer is just an expensive toy. But in vain! Of course, in order for a child to actually practice on it, you yourself need to learn how to work on it, and then teach the child. Well, that’s another topic, but today I want to talk to you about how to find the arithmetic mean in Excel.
How to find the arithmetic mean in Excel
We have already talked about fast in Excel, and today we will talk about the arithmetic average.
Select a cell C12 and with the help Function Wizards Let's write into it the formula for calculating the arithmetic mean. To do this, on the Standard toolbar, click on the button - Inserting a function –fx (in the picture above there is a red arrow at the top). A dialog box will open Function Master .
- Select in the field Categories — Statistical ;
- In field Select function: AVERAGE ;
- Click the button OK .

The following window will open Arguments and Functions .

In field Number1 you will see a recording C2:C11– the program itself has determined the range of cells for which it is necessary find the arithmetic mean.
Click the button OK and in the cell C12 The arithmetic mean of the scores will appear.

It turns out that calculating the arithmetic mean in Excel is not at all difficult. And I was always afraid of all kinds of formulas. Eh, we were studying at the wrong time.
Now let's talk about how to calculate average.
In its classical form, the general theory of statistics offers us one version of the rules for choosing an average value.
First, you need to create the correct logical formula for calculating the average value (AFV). For each average value there is always only one logical formula for calculating it, so it is difficult to make a mistake here. But we must always remember that in the numerator (this is what is on top of the fraction) the sum of all phenomena, and in the denominator (what is at the bottom of the fraction) the total number of elements.
After the logical formula has been compiled, you can use the rules (for ease of understanding, we will simplify and shorten them):
1. If the source data (determined by frequency) contains the denominator of a logical formula, then the calculation is carried out using the weighted arithmetic mean formula.
2. If the numerator of a logical formula is presented in the source data, then the calculation is carried out using the weighted harmonic average formula.
3. If the problem presents both the numerator and the denominator of a logical formula (this rarely happens), then we carry out the calculation using this formula or the simple arithmetic average formula.
This is the classic idea of choosing the right formula for calculating the average. Next, we present the sequence of actions when solving problems for calculating the average value.
Algorithm for solving problems on calculating the average value
A. Determine the method for calculating the average value - simple or weighted . If the data is presented in a table, then we use a weighted method, if the data is presented by a simple enumeration, then we use a simple calculation method.
B. Define or arrange symbols - x – option, f – frequency . Option is the phenomenon for which you want to find the average value. The remaining data in the table will be the frequency.
B. We determine the form for calculating the average value - arithmetic or harmonic . The determination is carried out using the frequency column. The arithmetic form is used if the frequencies are specified by an explicit quantity (conditionally, you can substitute the word pieces, the number of elements “pieces”). The harmonic form is used if frequencies are specified not by an explicit quantity, but by a complex indicator (the product of the averaged quantity and frequency).
The most difficult thing is to guess where and what quantity is given, especially for a student inexperienced in such matters. In such a situation, you can use one of the following methods. For some tasks (economic), a statement developed over years of practice is suitable (point B.1). In other situations, you will have to use point B.2.
B.1 If the frequency is given in monetary units (in rubles), then the harmonic average is used for calculation, this statement is always true, if the identified frequency is given in money, in other situations this rule does not apply.
B.2 Use the rules for choosing the average value indicated above in this article. If the frequency is given by the denominator of the logical formula for calculating the average value, then we calculate using the arithmetic mean form; if the frequency is given by the numerator of the logical formula for calculating the average value, then we calculate using the harmonic mean form.
Let's look at examples of the use of this algorithm.
A. Since the data is presented in a line, we use a simple calculation method.
B.V. We only have data on the amount of pensions, and they will be our option - x. The data is presented as a simple number (12 people), for calculation we use the simple arithmetic average.
The average pension for a pensioner is 9208.3 rubles.
B. Since we need to find the average payment per child, the options are in the first column, we put the designation x there, the second column automatically becomes the frequency f.
B. The frequency (number of children) is given by an explicit quantity (you can substitute the word pieces of children, from the point of view of the Russian language this is an incorrect phrase, but, in fact, it is very convenient to check), which means that the weighted arithmetic mean is used for the calculation.
The same problem can be solved not by a formulaic method, but by a tabular method, that is, entering all the data of intermediate calculations into a table.
As a result, all that needs to be done now is to separate the two totals in the correct order.
The average payment per child per month was 1,910 rubles.
A. Since the data is presented in the table, we use a weighted form for calculation.
B. Frequency (production cost) is given by an implicit quantity (frequency is given in rubles point of algorithm B1), which means that the weighted harmonic average is used for the calculation. In general, in essence, the cost of production is a complex indicator, which is obtained by multiplying the cost of a unit of a product by the number of such products, this is the essence of the harmonic mean value.
In order for this problem to be solved using the arithmetic mean formula, it is necessary that instead of the cost of production there should be the number of products with the corresponding cost.
Please note that the sum in the denominator obtained after calculations is 410 (120+80+210) this is the total number of products produced.
The average cost per unit of product was 314.4 rubles.
A. Since the data is presented in the table, we use a weighted form for calculation.
B. Since we need to find the average cost per unit of product, the options are in the first column, we put the designation x there, the second column automatically becomes the frequency f.
B. The frequency (total number of absences) is given by an implicit quantity (this is the product of two indicators of the number of absences and the number of students with that number of absences), which means that the weighted harmonic average is used for the calculation. We will use point of algorithm B2.
In order for this problem to be solved using the arithmetic mean formula, it is necessary that instead of the total number of absences there should be the number of students.
We create a logical formula for calculating the average number of absences per student.
Frequency by task condition Total number of omissions. In the logical formula, this indicator is in the numerator, which means we use the harmonic mean formula.
Please note that the sum in the denominator, resulting after calculations 31 (18+8+5), is the total number of students.
The average number of absences per student is 13.8 days.